Primary Services
Environmental Consulting
- Project Management
- Database Management
- Biological Monitoring and Management
- Statistical Analysis using R
- Avian and Raptor Surveys
- Herpetofaunal, Mammalian, and Invertebrate Surveys
- Wildlife Population Assessments and Habitat Modeling
- Wetland Delineation and Functional Assessments
- Ecological Community Classification and Biodiversity Indexing
- Long-Term Ecological Monitoring Design and Implementation
- Vegetation Mapping and Botanical Inventories
Geographic Information Systems (GIS), Geospatial Analysis and Cartography
- Cartography
- Terrain and Hydrological Modeling
- Geospatial Statistical Analyses
- Capturing and Storing Spatial Information
- LIDAR Cloud Analysis
- Spatial Data Management and Geodatabase Design
- Habitat Suitability Modeling
- Terrain and Hydrological Modeling
Information Technology (IT)
- Automation
- Programming
- Application Development
- Website Development
- API Integration
- Cloud Solutions
Service Descriptions
Overview
TwinVert delivers specialized environmental consulting services grounded in scientific rigor, operational transparency, and a deep understanding of ecological systems. We work with clients across public, private, and nonprofit sectors to design and execute projects that meet both environmental stewardship goals and regulatory obligations. Services are delivered under fully insured contracts, with clearly defined scopes of work, deliverables, timelines, and cost structures—ensuring accountability from initiation through final reporting. Whether addressing wildlife compliance, habitat evaluations, or conservation planning, TwinVert prioritizes measurable outcomes backed by defensible data and sound methodologies.
Project Management
TwinVert offers comprehensive project management services tailored to the needs of environmental and natural resource initiatives. Our approach spans the full project lifecycle—from early-stage scoping and permitting coordination to post-project analysis and close-out documentation. We specialize in integrating multi-disciplinary teams, overseeing field logistics, managing subcontractor contributions, and ensuring strict adherence to evolving environmental regulations (e.g., NEPA, ESA, Clean Water Act). Each project is supported by a dedicated manager with access to a scalable team of technical specialists, allowing for agile staffing in response to changing conditions or expanded scopes. Our in-house tools also enable timeline tracking, budget forecasting, and performance reporting to keep all stakeholders aligned and informed.
Data Collection
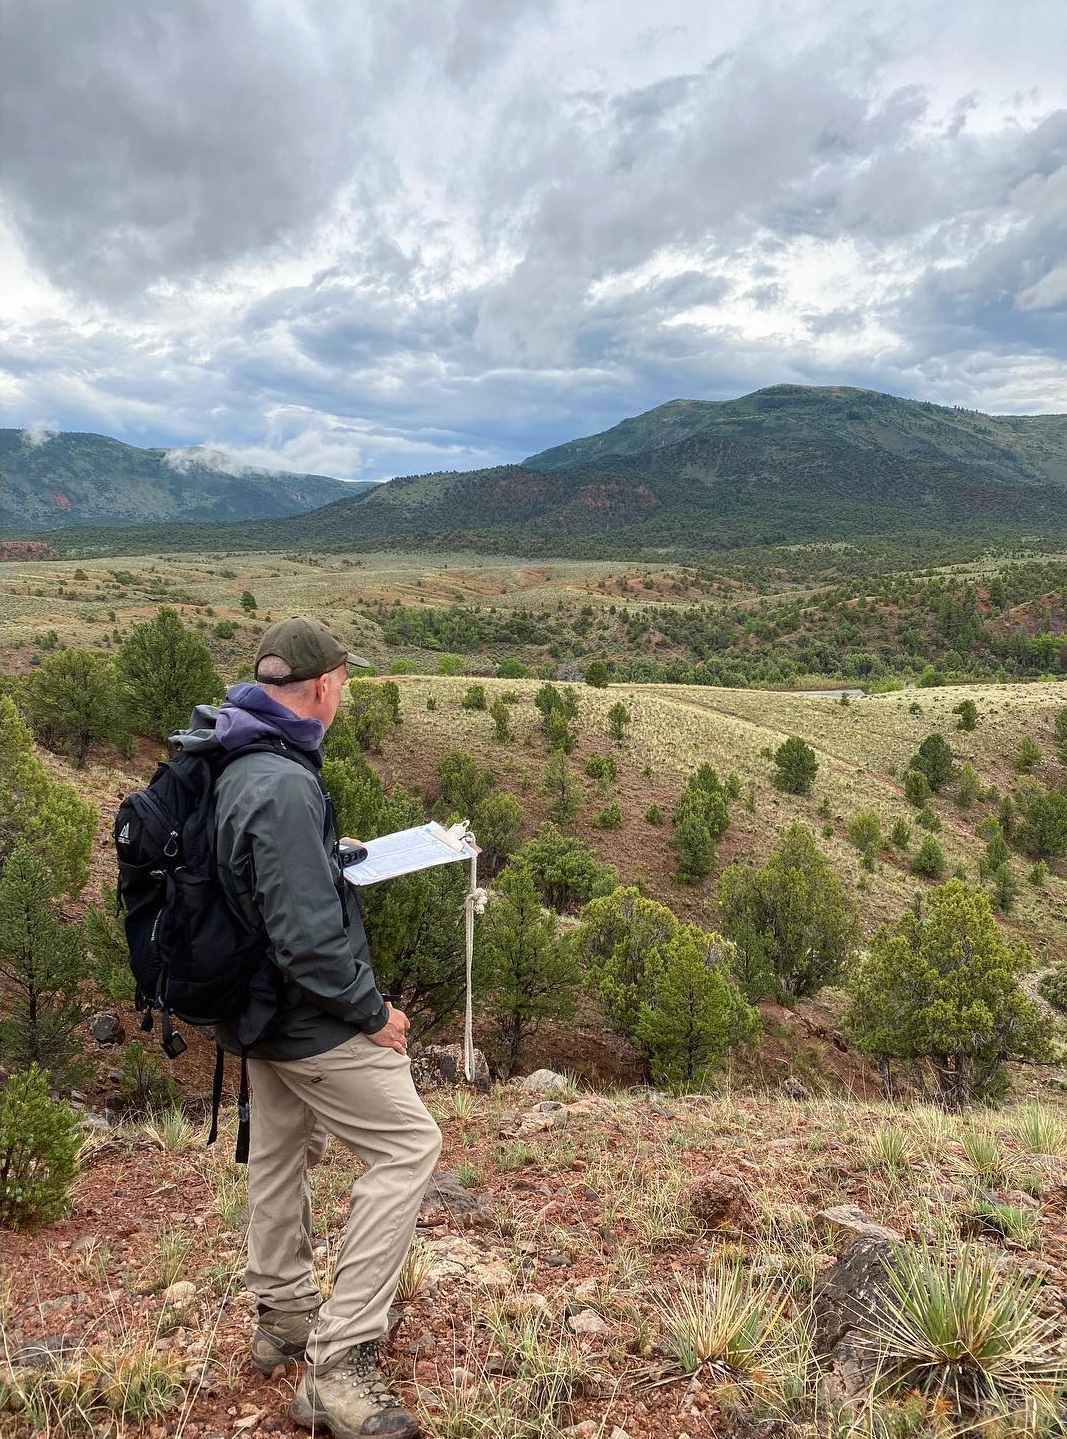
TwinVert’s data collection services are built around scientific integrity and regulatory compliance. Every project begins with a thorough review of existing environmental, biological, and geospatial datasets to identify information gaps relative to project objectives or permit requirements. When new data is needed, we design and implement field protocols aligned with agency-approved methodologies and industry best practices. Our field teams are equipped to conduct a wide array of surveys—including avian, botanical, aquatic, wetland, and habitat condition assessments—using high-accuracy GPS, mobile data platforms, and remote sensing technology where applicable. The resulting datasets are quality-controlled, formatted for integration into GIS and environmental databases, and structured to directly support subsequent analysis, modeling, or permitting submissions.
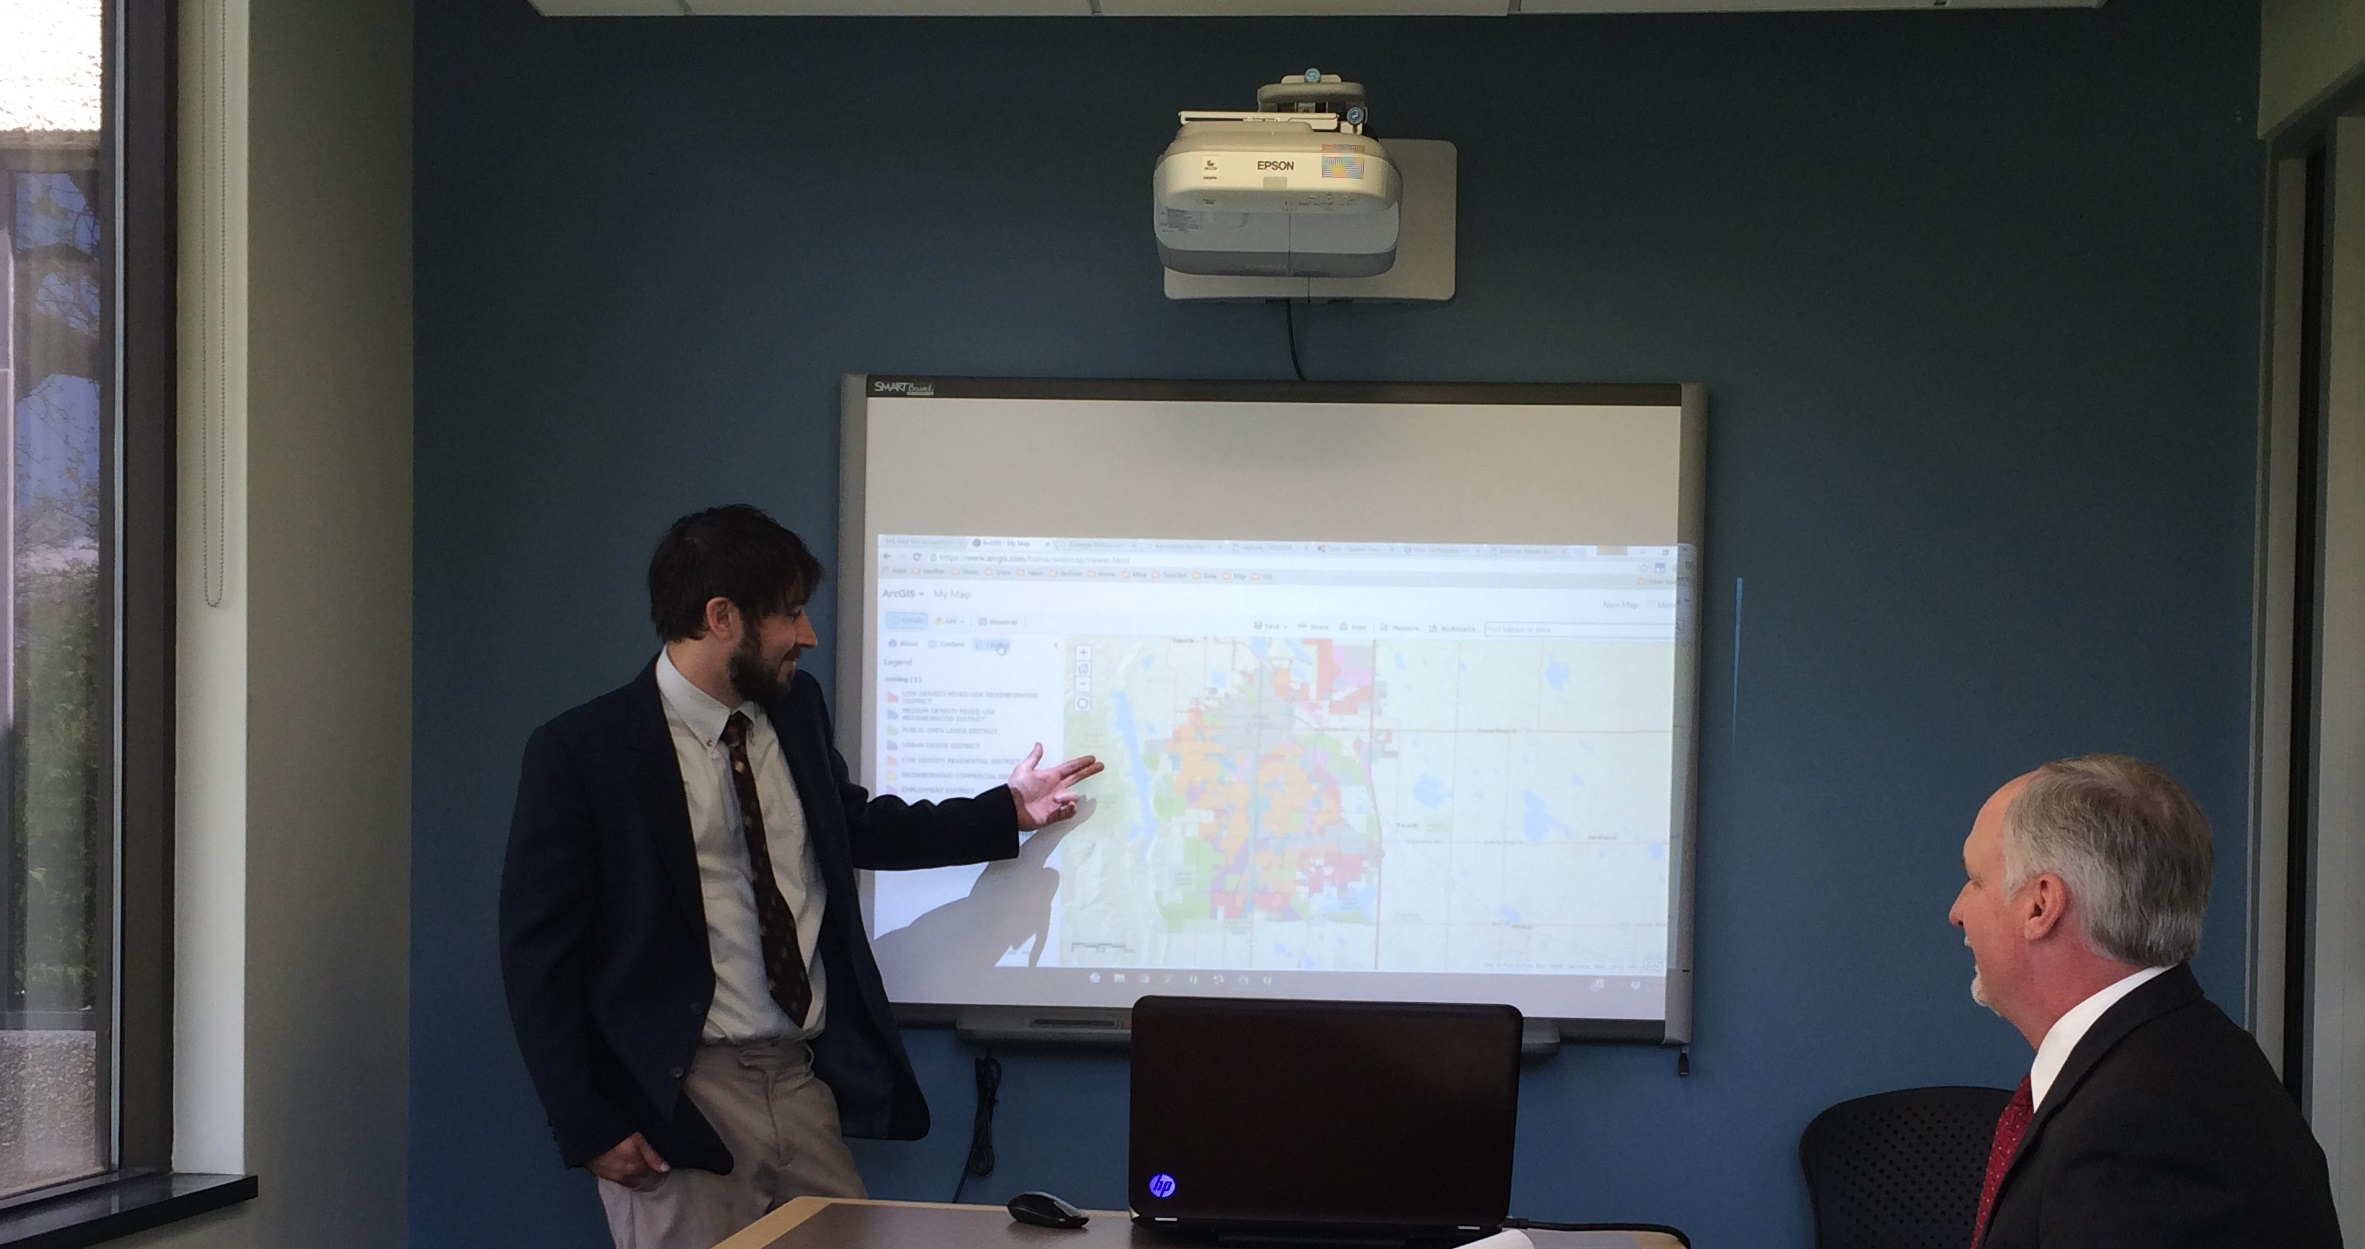
Geospatial Analysis and Cartography
TwinVert delivers advanced mapping services tailored to environmental, biological, and ecological applications. Our capabilities span high-resolution habitat delineation, species distribution modeling, wetland boundary mapping, and survey zone design. We support projects ranging from local site assessments to landscape-scale conservation planning, across terrestrial and aquatic environments.
Beyond standard GIS workflows, our team brings deep technical expertise in geospatial coding using Python with GDAL, R, and Julia. This foundation enables feature-rich automation, organized data architecture, and a reduced error rate in both data processing and map production. These capabilities are especially valuable for large or complex datasets requiring repeatable, scalable solutions.
We are experienced across a wide array of industry-standard tools, including QGIS, ArcGIS, and ERDAS Imagine, allowing us to integrate diverse data sources and client platforms. Whether supporting field operations with mobile-ready basemaps or generating analytical layers for impact modeling and regulatory filings, our maps are built to deliver scientific clarity, operational efficiency, and regulatory relevance.
Data Analysis
TwinVert offers advanced analytical services grounded in ecological science and statistical rigor. Our team is adept at interpreting complex biological and environmental datasets to inform conservation planning, regulatory compliance, and impact mitigation. We apply a suite of quantitative methods tailored to project goals and data conditions, ensuring that results are both scientifically defensible and operationally relevant.
We routinely conduct species richness and diversity analyses to assess ecosystem condition, evaluate community structure, and inform site prioritization. Temporal trend analyses are employed to quantify change over time in population dynamics, habitat parameters, and environmental quality—supporting long-term monitoring and adaptive management frameworks. For multidimensional datasets, we utilize multivariate statistical techniques such as Principal Component Analysis (PCA), Non-Metric Multidimensional Scaling (NMDS), and redundancy analysis (RDA) to uncover underlying ecological gradients and reveal meaningful patterns in species-environment relationships.
These methods are integrated with spatial data products when appropriate, allowing for seamless alignment between field observations, geospatial context, and regulatory deliverables. Whether conducting impact assessments, evaluating mitigation performance, or modeling habitat suitability, TwinVert delivers analytical outputs that elevate the precision and credibility of every project we support.
Dissemination
Twinvert delivers results through a range of professional, adaptable formats designed to meet both technical standards and stakeholder expectations. We provide spatial data products, statistical outputs, and interpretive reports in digital and print-ready formats, including geodatabases, map books, high-resolution PDFs, and structured tabular reports. All deliverables are tailored to client specifications and can be integrated directly into permitting packages, planning documents, or internal decision-support systems. Our work is underpinned by high-quality technical writing that ensures clarity, precision, and usability for diverse audiences.
Our team prioritizes transparency and collaboration throughout the project lifecycle. We utilize secure, cloud-based platforms to facilitate real-time data sharing, feedback exchange, and version control—ensuring clients and partners remain fully informed and engaged. Whether you're coordinating across agencies, reviewing iterative drafts, or preparing for public comment, TwinVert ensures that your project outputs are accurate, accessible, and actionable.